Ensuring power supply reliability by monitoring device stress limits
Every switching device has a maximum voltage, current and power specified by the device manufacturer. The reliability of the power supply is dependent on not exceeding these limits. Safe Operating Area (SOA) plots help confirm operating margins. The purpose of an SOA plot is to determine if the device exceeds its maximum voltage, current, or power ratings.
To determine whether the device is outside of its safe operating range an operator can use either of the following:
- the mask provided by the manufacturer
- the automatic parameters of maximum current, voltage and power for the waveform
In Figure 1 the yellow upper trace (Channel 1) shows a MOSFET’s drain-source voltage acquired using a differential probe, and the red trace (channel 2) shows the MOSFET’s drain current waveform in a switch mode power supply acquired using a current probe.
Current (vertical axis) vs. voltage (horizontal axis) is displayed as an XY trace known as a Safe Operating Area Plot. The upper-right corner of the XY trace represents the maximum power. In addition, parameters read the maximum current, voltage, and power for the whole waveform and they can be easily compared with the limits.
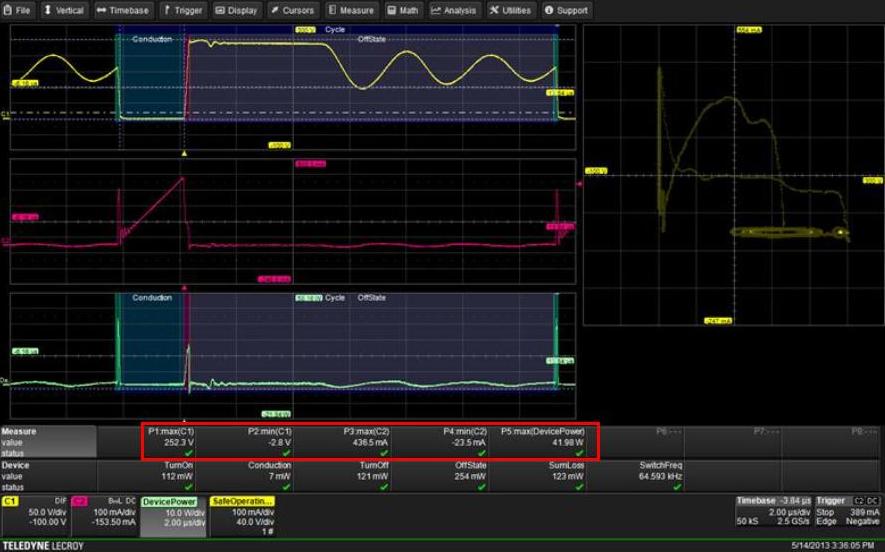
Figure 1: Using the maximum parameter to measure the maximum voltage, current, and power
Using the mask to check safe operating area
In Figure 2 (below) the manufacturer’s mask is used. The bounds for the mask can be defined by entering the device limits defined by the manufacturer or desired test limits. A circular red marker appears around each data point that exceeds the mask limits.

Figure 2: Using the Mask to check if the device exceeds its maximum voltage, current, or power ratings
The SOA plot is a feature of Teledyne LeCroy’s power analysis software. Because of the long memories available in these oscilloscopes it is possible to find SOA violations that occur even for only a few cycles after an event, e.g. a short circuit or start-up. Such low duty -cycle events can be problematic. If they go undetected they can degrade the device over time and consequently reduce system reliability.
Example of severe SOA violation
The SOA plot for the power supply startup shown in figure 3 shows larger excursions from the origin. This indicates a greater stress on the device. Note that the peak voltage has increased from 252 to 290 Volts. Peak current is 1.79 A compared to 0.436 A during steady state. The maximum power dissipated by the MOSFET increases from 42 to 92 W.

Figure 3: The SOA plot for power supply startup shows a more severe operational range of voltage, current and power
Conclusion
SAO plots reveal a great deal about the operating conditions of power devices in different operating modes. Combined with parameter measurements for interpretation of maximum voltage, current and power levels and the mask, they are incredibly useful in ensuring power supply reliability – often the weakest point in a system.